The geography of divorce
Drafted April 30, 2026. Revised May 1, 2026.
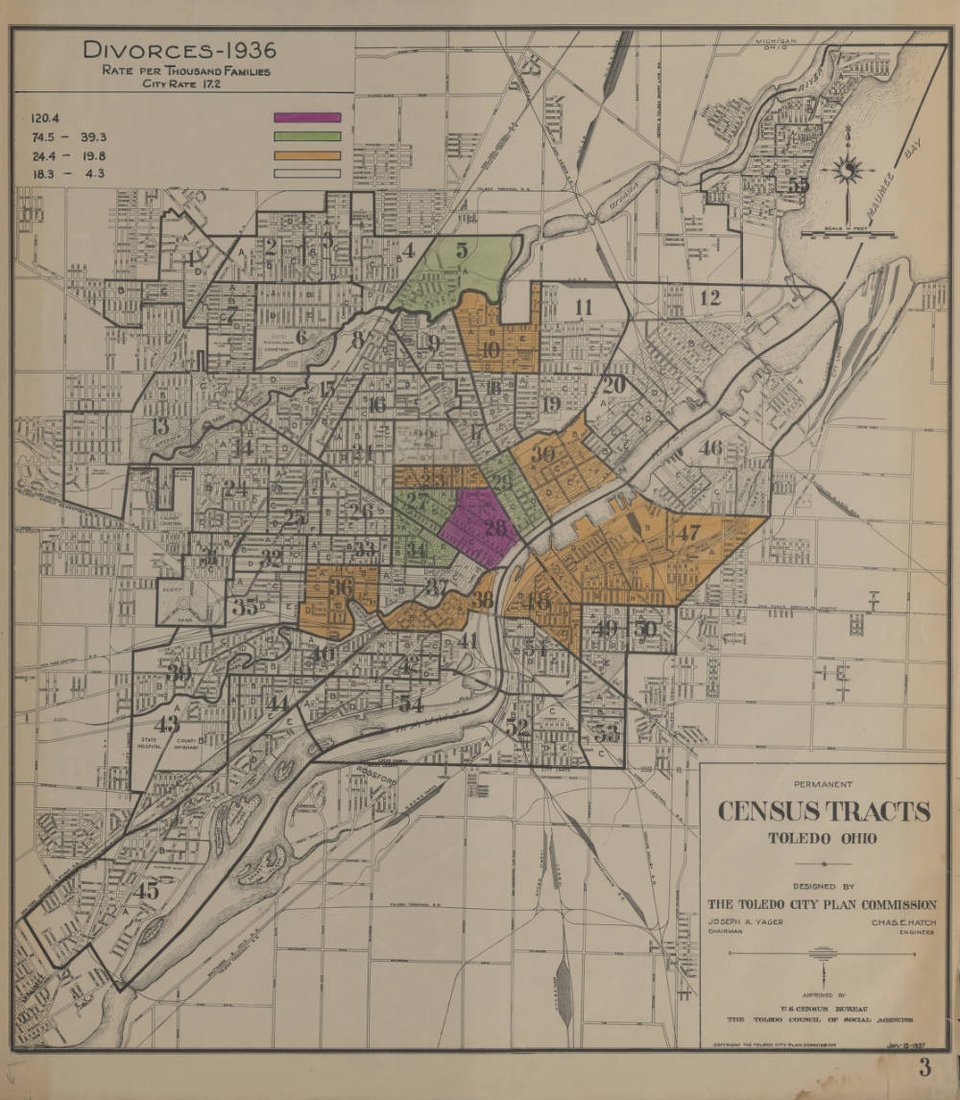
My undergraduate degree was in geography, and I’m a lifelong map lover. So naturally, one day I got bored on the internet and started trying to find historical maps of divorce rates.
Unfortunately I didn’t find much, but I did find this interesting 1930s map of divorce rates by Census tract in Toledo (city of my birth!).
Interestingly, the CDC publishes divorce rate maps by state. Here is the 2023 map.
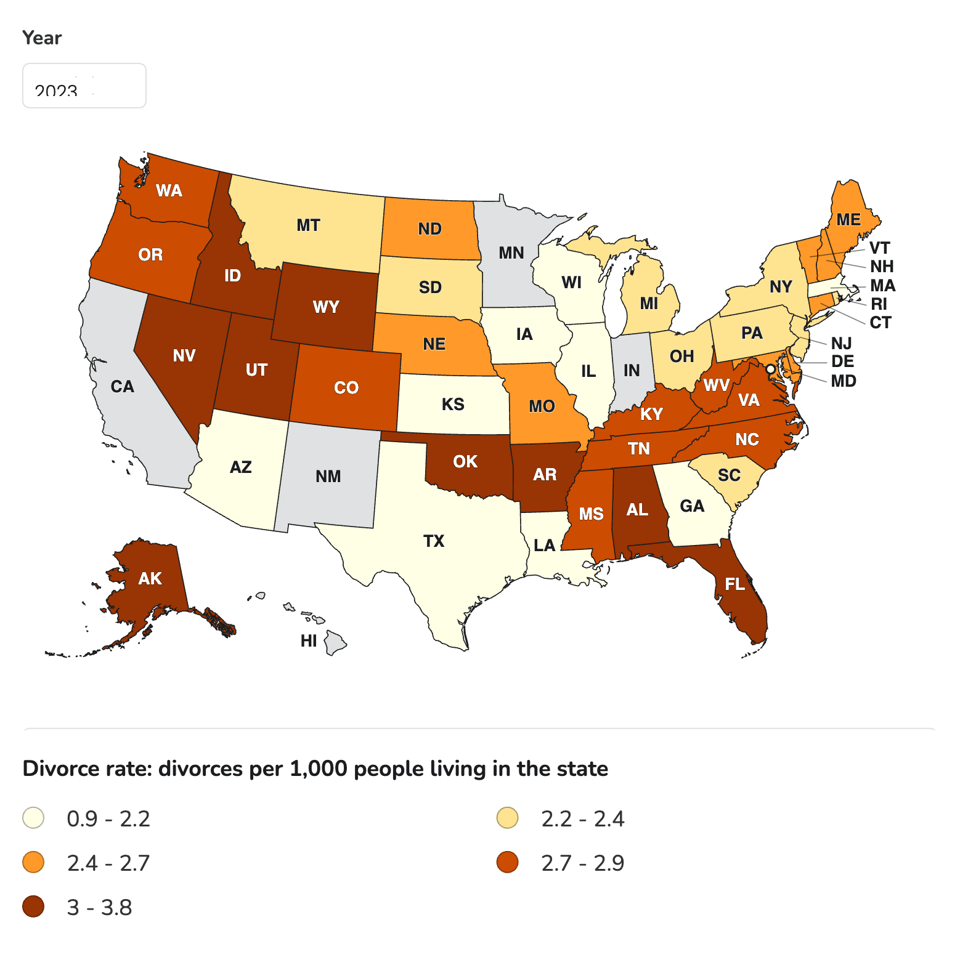
If you’ve skimmed the very strange (some might say psychotically patriarchal) Heritage Foundation report on the family, you might think based on their claims about religiosity coinciding with lower divorce rates that the divorce rates would be lower in such famously anti-religious states as checks notes Utah and Alabama. But ah, well, sometimes maps have an inconvenient way of showing just how lousy right-wingers are when it comes to research.
If you ever want to dig deep into divorce statistics, it looks like Bowling Green State University has you covered (personally I found the median age at first divorce pretty interesting!).
Upgrade nowThis is a free post, but many of my posts are paywalled. If you’d like to go ahead and buy a subscription now to support my writing, you can click the button above. $25 a year helps pay for my cat’s portion of the monthly rent. Hugs and kisses to the 23 folks who have already upgraded their subscriptions. I truly appreciate your support :)